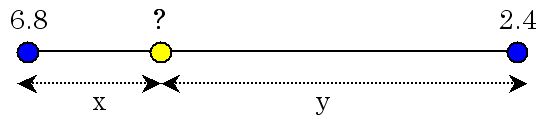
The simple example of liner interpolation. In this case, the value at yellow point is 6.8 y/(x+y) + 2.4 x/(x+y)
This online system generates meteorological data for inputting the SEIB-DGVM v2.60 to v2.82. For v1.42 to v2.55, please use our old system.
The material of this data generator is CRU TS3.22 observation based data. Time interval of the CRU TS3.22 is monthly, while the SEIB-DGVM requires daily climate data. To fill this gap, this system employs NCEP/NCAR daily climate data for providing daily climatic variability within each month (see "How this system generate data?" at section below for detail). The resultant data contained following items: Air temperature, Soil temperatures at 0-10cm depth, Soil temperatures at 10-200cm depth, Soil temperatures at 300cm depth, Precipitation, Total cloudiness, Wind velocity, Specific humidity, and Daily air temperature range.
15 Jan 2014
"Diurnal Temperature Range" was added to the output file. This variable appends as the last item for each line of data. Therefore, previous versions of the SEIB-DGVM can input climate data generated by the modified climate-data-generator (The new item will be just ignored).
15 Jan 2015
(1) We reconstructed the climate data using the latest CRU data-set TS3.22. Now, this system can generate climate data during years of 1901 to 2013 (Previously 1901~2005).
(2) For cloudness, daily values of NCEP/NCAR reanalysis in the year 1950 will be linearly scaled by multiplying a constant (month and location specific) so that its monthly average becomes as same as the values of corresponding month of CRU-TS3.22. In the previous climate-data-generator, daily value of NCEP/NCAR reanalysis in the year 1950 was simply employed for every years.
(3) For soil temperatures, daily value of NCEP/NCAR reanalysis in the year 1950 was simply employed for every years of the generated data. This means that we ignore inter-annual variability and development of soil temperature. In the previous climate-data-generator, daily values of NCEP/NCAR reanalysis in the year 1950 were linearly scaled by adding a constant (year and location specific) so that its annual mean becomes as same as the air-temperature of corresponding year and location of CRU-TS3.0.
1. This web-system can be used by any person and by any organs for fair usages.
2. The data is provided with no guarantees as to the accuracy, correctness or utility of the output produced.
3. Publications should give adequately citation to the original climate dataset (see section "About original climate dataset").
Surface climate data extending over global land areas, excluding Antarctica. These gridded data are based on an archive of monthly mean temperatures provided by more than 4000 weather stations distributed around the world.
The original data was downloaded from following website:
British Atmospheric sData Centre (BADC)
Detailed description of the data set is also available on the website.
The citation paper of the original data:
Harris, I., Jones, P.D., Osborn, T.J. and Lister, D.H. (2014)
Updated high-resolution grids of monthly climatic observations - the CRU TS3.10 Dataset
International Journal of Climatology, 34(3), 623-642, doi: 10.1002/joc.3711
An outcome of data assimilation technique using a climate forecasting model. Observed climatic data from 1948 to the present are analyzed, interpolated onto a system of grids, then employed for initialization and forcing of the model.
The citation paper of the original data:
Kalnay et al.,The NCEP/NCAR 40-year reanalysis project, Bull. Amer. Meteor. Soc., 77, 437-470, 1996.
The original data was downloaded from following website:
The NCEP/NCAR Reanalysis Project at the NOAA/ESRL Physical Sciences Division
Detailed description of the data set is also available. Note that we used daily data.
(0) 1 year daily climatic data (air temperature, soil temperature, precipitation, total cloud cover, specific humidity, wind velocity, and downward short wave radiation) during 1950 was obtained from the NCEP/NCAR reanalysis daily climatic dataset. Spatial resolution of the original data was 192×94 global grids, and was linearly interpolated to 0.5 degree grid mesh, which corresponds to the spatial resolution in CRU TS3.22 data. Using this interpolated daily data, all items (except for daily range of air temperature) of CRU TS3.22 monthly climatic data will be scaled to daily as follows.
For air temperature, NCEP/NCAR reanalysis will be linearly scaled by adding a constant (month and location specific) so that its monthly mean becomes as same as the values of corresponding month and location of CRU-TS3.22.
For cloudness, NCEP/NCAR reanalysis will be linearly scaled by multiplying a constant (month and location specific) so that its monthly mean becomes as same as the values of corresponding month and location of CRU-TS3.22.
For precipitation and specific humidity, daily values of NCEP/NCAR reanalysis will be linearly scaled by multiplying a constant (month and location specific) so that its monthly total becomes as same as the values of corresponding month of CRU-TS3.22.
For soil temperatures and wind velocity, NCEP/NCAR reanalysis was simply employed.
(1) From specified latitude and longitude, select 4 grids that will be referred to generate data (see "Data interpolation method").
(2) Generate data through linear interpolation, which is described below. This interpolation procedure is omitted for ocean grids, which do not contain any values.
(3) Display generated data in the format that meets to input to SEIB-DGVM.
From coarse original data, this web system generate climate data of your specified location through simple liner interpolation as below.
The simple example of liner interpolation.
In this case, the value at yellow point is 6.8 y/(x+y) + 2.4 x/(x+y)
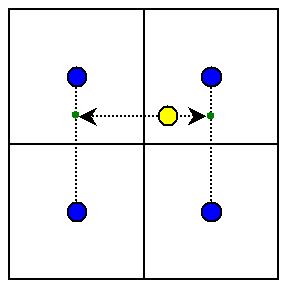
To obtain the interpolated value at your selected location, values at most proximate 4 grids will be referred. First, values at green dots will be obtained by above method. Then, applying the same method to the green dots, value at yellow dot will be calculated.
(Sorry in Japanese)
このシステムで使用している全球気象データを提供します。無料です。上のConditions of useをお守り頂き、そして論文のacknowledgmentにでも私の名前を書いて下さるのが提供条件です。
このシステムでは0.5度メッシュ(CRU TS3.0と同じ解像度)105年Dailyのデータを元に 任意地点の気象データを線形補完していますが、他に1.0度メッシュ、2.0度メッシュのデータも用意しています。それぞれデータセットの大体の大きさは、無圧縮で93・22・6GB、tarzip圧縮したもので52・12・3Gです。データの諸元をまとめたテキストファイルと、データ変換に使用したFortran90のコードも添付します。
ご希望の方は、事前にコンタクトを取った後、ポータブルHDD等を郵送して下さい。データをコピーしてから、着払い便にて返送いたします。BDドライブをお持ちの方は、BDRに焼いてお送りしますので、メディアの送付は無用です。
