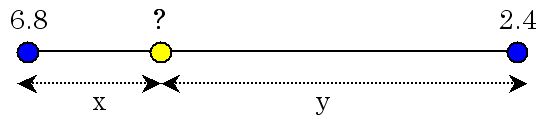
The simple example of liner interporation. In this case, the value at yellow point is 6.8 y/(x+y) + 2.4 x/(x+y)
This online system generates meteorological data for inputting the SEIB-DGVM (v1.42 to v2.55) through simple linear interpolations from NCEP/NCAR reanalysis data. Adjustment options with observation based meteorological data is also available.
1. This web-system can be used by any person and by any organs for fair usages.
2. The data is provided with no guarantees as to the accuracy, correctness or utlility of the output produced.
3. Publications should give adequately citation to the original climate dataset (see section "About original climate dataset").
The citation paper of the original data is:
Kalnay et al.,The NCEP/NCAR 40-year reanalysis project, Bull. Amer. Meteor. Soc., 77, 437-470, 1996.
The original climate data of this system was obtained from following website:
The NCEP/NCAR Reanalysis Project at the NOAA/ESRL Physical Sciences Division
Detailed description of the data set is also available. Note that we used daily data.
If you acquire products from this data set, I suggest you to acknowledge them in your use of the data. This may be done by including text such as "NCEP Reanalysis data provided by the NOAA/OAR/ESRL PSD, Boulder, Colorado, USA, from their Web site at http://www.cdc.noaa.gov/" in any documents or publications using these data. They would also appreciate receiving a copy of the relevant publications. This will help them to justify keeping the NCEP Reanalysis data set freely available online in the future.
The citation paper of the original data is:
New, M., M. Hulme and P. Jones (2000). "Representing twentieth-century space-time climate variability. Part II: Development of 1901-1996 monthly grids of terrestrial surface climate." Journal of Climate 13(13): 2217-2238.
A 0.5 degree lat/lon dataset of monthly surface climate extending from 1901 to near real-time (currently 1995) over global land areas, excluding Antarctica. Primary variables are interpolated directly from station time-series: precipitation, mean temperature and diurnal temperature range. Secondary variables are interpolated from station series where data are available and estimated using relationships with primary variables in regions with no data: wet-day frequency, vapour pressure, cloud cover and ground-frost frequency. Value of selected location will be estimated by simple liner interporation in this web system.
Available on CD or via ftp from the Climatic Research Unit. There is a handling charge to cover the costs of postage, relevant publications, data storage and maintenance of the dataset.
The citation paper of the original data is:
Adler, R. F., et al. (2003), The version-2 global precipitation climatology project (GPCP) monthly precipitation analysis (1979-present), Journal of Hydrometeorology, 4(6), 1147-1167.
This is observation based data, which combines the precipitation information available from each of several sources into a final merged product, taking advantage of the strengths of each data type. GPCP is proprovided 2.5 degree mesh, and value of selected location will be estimated by simple liner interporation in this web system.
The original GPCP data of this system was obtained from following website:
Global Precipitation Analysis, Laboratory for Atmospheres NASA Goddard Space Flight Center
Detailed description of the data set is also available.
(1) From specified latitude and longitude, select 4 grids that will be refered to generate data (see "Data interporation method").
(2) Ocean grids do not have soil temperature data. So, if selected grids contains ocean, soil temperature was substituted from air temperature of the same grids.
(3) Generate data through linear interporation, which is described below.
(4) When scale option is selected, data will be linearly scaled with observation based meteorological data so that monthly averages will be identical.
(5) Display generted data in the format that meets to input to SEIB-DGVM.
From coarse original data, this web system generate climate data of your specifyed location through simple liner interporation as below.
The simple example of liner interporation.
In this case, the value at yellow point is 6.8 y/(x+y) + 2.4 x/(x+y)
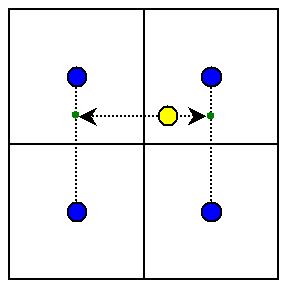
To obtain the interporated value at your selected location, values at most proximiting 4 grids will be referred. First, values at green dots will be obtained by above method. Then, applying the same method to the green dots, value at yellow dot will be calculated.
31 July 2008: We introduced adjustment option with CRU05 data.
2 June 2008: We introduced adjustment option with GPCP data.
20 Feb 2008: In generated data for a period of 1948~1966, this web service provided 1/1000 times values for humidity. We fixed this bug. Sorry for this inconvenience.
The author (Hisashi SATO) thanks Dr. Takashi KOHYAMA and Dr. Shigeaki HASEGAWA for providing and mainteing a web-server that hosts this web-system.
